The night sky, a canvas of seemingly immutable points of light, holds within it an astonishing universe of secrets. For centuries, humanity has gazed upwards, captivated by the celestial dance. Yet, our eyes alone perceive only a fraction of the cosmic tapestry. To truly understand the distant galaxies, the fiery stars, and the enigmatic nebulae, astronomers delve deeper, employing sophisticated techniques that transform the invisible into the observable. Among these crucial tools, color mapping stands as a paramount method, a silent storyteller that translates the language of light into tangible knowledge about the universe. This article will unveil the profound reasons why astronomers meticulously employ color mapping, exploring how it transcends mere visual enhancement to become an indispensable tool for deciphering the composition, temperature, age, and dynamics of celestial bodies.
The light that reaches Earth from celestial objects is not a monolithic entity. It is a complex interplay of electromagnetic radiation, spanning a vast spectrum of wavelengths, each carrying its own unique information. Visible light, the portion our eyes can detect, is merely a sliver of this cosmic spectrum. Radio waves, microwaves, infrared radiation, ultraviolet light, X-rays, and gamma rays all emanate from stars, galaxies, and other cosmic phenomena, carrying different clues about their physical processes. Astronomers, therefore, must find ways to access and interpret this broader spectrum.
Invisible Rays, Visible Insights
While the human eye is exquisitely tuned to the visible light spectrum, it is blind to the wealth of information carried by other forms of electromagnetic radiation. Radio telescopes can detect faint radio waves emitted by vast clouds of gas and dust, hinting at the birthplaces of stars. Infrared telescopes can peer through obscuring dust clouds to reveal the warmth of nascent stars and planets, or the cooler signatures of ancient celestial objects. Ultraviolet light, on the other hand, is crucial for studying the hottest, most energetic stars and the processes occurring in their atmospheres. X-rays and gamma rays, the most energetic forms of radiation, are signatures of extreme cosmic events like supernovae, black hole activity, and the cores of active galaxies. By studying these invisible wavelengths, astronomers gain access to phenomena that would otherwise remain hidden.
The Invisible Becomes Visible Through Translation
The fundamental challenge with these non-visible wavelengths is that we cannot directly “see” them with our eyes. To analyze this information, astronomers must convert these invisible signals into a format that can be visualized and understood. This is where the concept of “mapping” comes into play. Rather than simply displaying raw data, which might appear as complex graphs or numbers, astronomers create visual representations. Color mapping is the primary technique used to achieve this transformation, allowing us to perceive the intensity and distribution of different wavelengths across the sky.
Astronomers utilize color mapping as a vital tool in their research to visualize and interpret the vast amounts of data collected from celestial objects. By assigning different colors to various wavelengths of light, they can reveal important information about the composition, temperature, and motion of stars and galaxies. For a deeper understanding of the significance of color mapping in astronomy, you can read more in this related article at Freaky Science.
Translating Data into Dimensions: The Art and Science of False Color
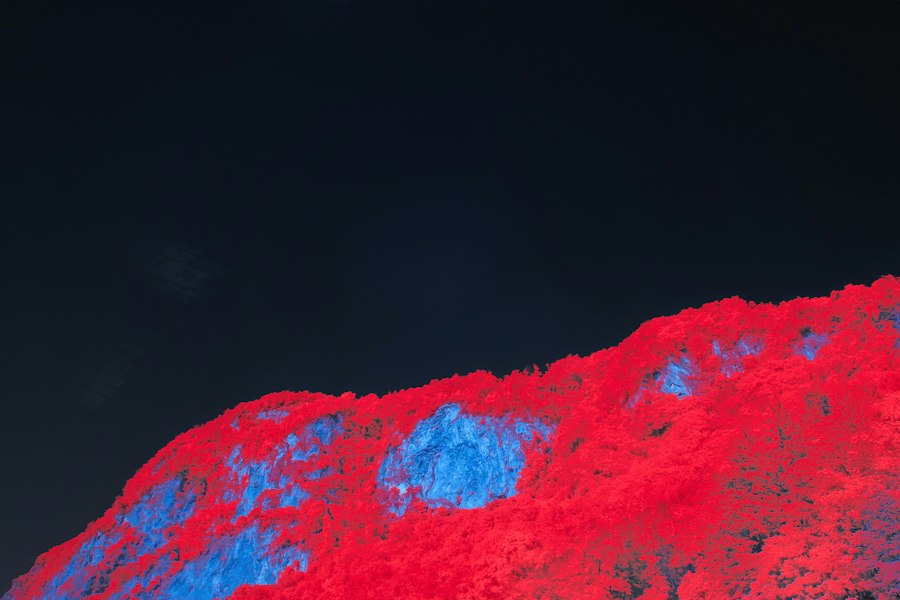
The colors we perceive in everyday life are a result of how objects reflect or emit visible light. When astronomers apply color mapping to astronomical data, they are essentially assigning arbitrary colors to represent specific data values, often related to the intensity of a particular wavelength or property. This is known as “false color” or “pseudocolor” mapping, as it does not represent the true color of the object as it would appear if we could see it in that specific wavelength with our own eyes. The power of false color lies in its ability to highlight subtle variations and patterns that would be lost in grayscale or purely numerical representations.
The Palette of Discovery
The choice of color palette is not arbitrary; it is carefully considered to convey specific information effectively. Common color schemes involve using a spectrum of colors, such as blue, green, yellow, orange, and red, to represent increasing intensity or temperature. For instance, in a thermal image, cooler regions might be depicted in blues and greens, while hotter regions would be rendered in yellows, oranges, and reds. Alternatively, different colors might be used to represent distinct elements or chemical compositions detected in a celestial object. For example, hydrogen might be shown in one color, helium in another, and heavier elements in yet another.
Unveiling Hidden Structures and Gradients
False color mapping excels at revealing structures and gradients that are difficult to discern in raw data. A faint nebula might appear as a diffuse cloud in a grayscale image, but when mapped with vibrant colors, its intricate filaments, pockets of denser gas, and regions of varying temperature can become strikingly apparent. Similarly, the distribution of different elements within a star or a galaxy can be visualized, allowing astronomers to study processes like stellar evolution, galactic mergers, and the formation of planetary systems. Subtle differences in temperature across the surface of a star, or variations in gas density within a galaxy, can be amplified through the use of color, drawing the observer’s attention to these critical features.
Decoding the Cosmic Fingerprints: Composition and Temperature
One of the most fundamental applications of color mapping in astronomy is the determination of celestial object composition and temperature. Different elements and molecules emit and absorb light at specific wavelengths, creating unique spectral “fingerprints.” By analyzing these fingerprints, astronomers can deduce what these distant objects are made of. Color mapping provides a powerful way to visualize these spectral signatures.
Spectral Signatures Revealed
When astronomers observe a celestial object through a spectrograph, they are essentially dissecting its light into its constituent wavelengths. This creates a spectrum, which is essentially a graph of light intensity versus wavelength. Certain wavelengths will show dips (absorption lines), indicating that specific elements in the object’s atmosphere have absorbed that particular light. Other wavelengths will show peaks (emission lines), revealing that those elements are emitting light at those specific energies. Color mapping can be used to highlight these lines, making them easily identifiable and allowing for direct comparison with known spectral patterns of elements.
Temperature Gradients and Stellar Evolution
Color mapping is particularly effective at revealing temperature variations across celestial objects. For instance, when observing a star, different colors can be assigned to represent different temperature ranges on its surface. This allows astronomers to identify hotter regions, such as active starspots or areas of intense stellar flares, and cooler regions. By studying these temperature gradients, astronomers can gain insights into stellar activity, the rate of energy production within the star, and its evolutionary stage. Similarly, for nebulae, color mapping can reveal areas of varying temperature, indicating where new stars are forming or where stellar winds are heating the surrounding gas. The understanding of stellar evolution is heavily reliant on observing stars at different stages, and color mapping helps differentiate these stages by revealing their characteristic temperature profiles.
Mapping Motion and Dynamics: The Doppler Effect in Color
Beyond static properties like composition and temperature, color mapping also plays a crucial role in understanding the dynamic nature of the universe, particularly through the visualization of the Doppler effect. The Doppler effect, in the context of light, describes the change in wavelength of light due to the relative motion of the source and observer.
Redshift and Blueshift: Cosmic Speedometers
When a celestial object is moving away from Earth, the wavelengths of the light it emits are stretched, shifting towards the red end of the spectrum – this is known as redshift. Conversely, if an object is moving towards Earth, its light is compressed, shifting towards the blue end of the spectrum – this is blueshift. Color mapping can be used to visualize these shifts. Regions of redshift might be depicted in red hues, while regions of blueshift are shown in blue. This allows astronomers to map the distribution of these shifts across an object or a region of space.
Galactic Rotation and Stellar Winds
By observing the redshift and blueshift across different parts of a galaxy, astronomers can map its rotation. For example, one side of a rotating galaxy might be redshifted (moving away), while the other side is blueshifted (moving towards us). Color mapping these shifts provides a visual representation of the galaxy’s angular velocity. Similarly, color mapping can reveal the outflow of gas from active galactic nuclei or the expanding shells of gas around dying stars, providing insights into the powerful forces at play in the cosmos. The study of stellar winds, the continuous stream of charged particles ejected from stars, also benefits from color mapping, as it can highlight regions of higher or lower wind speed.
Astronomers often utilize color mapping to enhance their understanding of celestial objects and phenomena, as it allows them to visualize data in a more intuitive way. By applying different colors to various wavelengths of light, they can identify temperature variations, chemical compositions, and even the motion of stars and galaxies. For a deeper insight into the techniques and benefits of color mapping in astronomy, you can read this informative article on the subject. Exploring this topic further can reveal how these methods contribute to our expanding knowledge of the universe. For more details, check out this article.
Unveiling Cosmic Structures: From Nebulae to Galaxies
| Reasons | Explanation |
|---|---|
| Highlighting different wavelengths | Color mapping helps astronomers to represent different wavelengths of light, such as infrared, visible, and ultraviolet, in a single image. |
| Enhancing contrast | Color mapping allows astronomers to enhance the contrast in astronomical images, making it easier to distinguish between different features and objects. |
| Visualizing temperature variations | By using color mapping, astronomers can visualize temperature variations in celestial objects, such as stars and galaxies, with different colors representing different temperatures. |
| Conveying complex data | Color mapping helps in conveying complex data and information in a more visually appealing and understandable way, making it easier for researchers and the public to interpret astronomical images. |
The vastness of space is populated by an intricate network of celestial structures, from the ethereal beauty of nebulae to the majestic grandeur of galaxies. Color mapping is an indispensable tool for revealing the intricate details and relationships within these cosmic formations.
The Sculpted Forms of Nebulae
Nebulae, often described as the nurseries and graveyards of stars, are vast clouds of gas and dust. While appearing as diffuse smudges in optical telescopes, color mapping can bring their intricate structures to life. Different colors can be assigned to represent the density of gas, the presence of specific molecules, or the temperature variations within the nebula. This allows astronomers to identify the dense cores where stars are being born, the glowing filaments of ionized gas, and the shockwaves generated by supernovae. The detailed structures within nebulae, such as pillars of creation or turbulent gas flows, are often only fully appreciated through the application of advanced color mapping techniques that highlight subtle density and temperature gradients.
The Grand Designs of Galaxies
Galaxies, colossal collections of stars, gas, and dust, exhibit a dazzling array of shapes and sizes. Color mapping is used to study their morphology, the distribution of their stellar populations, and the processes of star formation within them. For instance, regions of active star formation, which are often hotter and emit more ultraviolet light, can be highlighted with specific colors, contrasting with the cooler, older stellar populations depicted in different hues. By color-coding different spectral components or the distribution of specific elements, astronomers can visualize the spiral arms of galaxies, the dust lanes that obscure their centers, and the chaotic interactions that occur when galaxies merge. The visualization of dark matter distribution, inferred through gravitational lensing effects that are also mapped, can further enhance our understanding of galactic structure and evolution through the use of color.
Beyond Visualization: Quantitative Analysis and Scientific Discovery
While the visual appeal of color-mapped astronomical images is undeniable, their true power lies in their ability to facilitate quantitative analysis and drive scientific discovery. The colors assigned are not merely aesthetic choices; they represent precise data values that can be measured and interpreted.
Quantitative Data Representation
Each color in a mapped image corresponds to a specific numerical value within the dataset. Astronomers can use software to extract these values, allowing for precise measurements of intensity, temperature, velocity, or elemental abundance at any given point in the image. This quantitative information is essential for building theoretical models, testing hypotheses, and publishing scientific findings. For example, the precise redshift measured from a color-mapped region can be used to calculate the distance to a galaxy, a fundamental piece of information for understanding the scale of the universe.
Unveiling the Unseen: Driving New Discoveries
By revealing subtle features and patterns that would otherwise remain hidden, color mapping empowers astronomers to make new discoveries. It can highlight anomalies, unexpected correlations, or previously unobserved phenomena, prompting further investigation and leading to breakthroughs in our understanding of the cosmos. The identification of exoplanets, for instance, can be aided by color mapping subtle variations in the light emitted by a star, indicating the presence of a planet passing in front of it. The study of cosmic microwave background radiation, the afterglow of the Big Bang, relies heavily on color mapping subtle temperature fluctuations to understand the early universe. Ultimately, color mapping transforms raw data into a language that the human mind can readily process, fostering intuition and guiding the quest for knowledge about the universe. It is a bridge between the abstract realm of numbers and the intuitive understanding of visual patterns, a vital tool in humanity’s ongoing exploration of the cosmos.
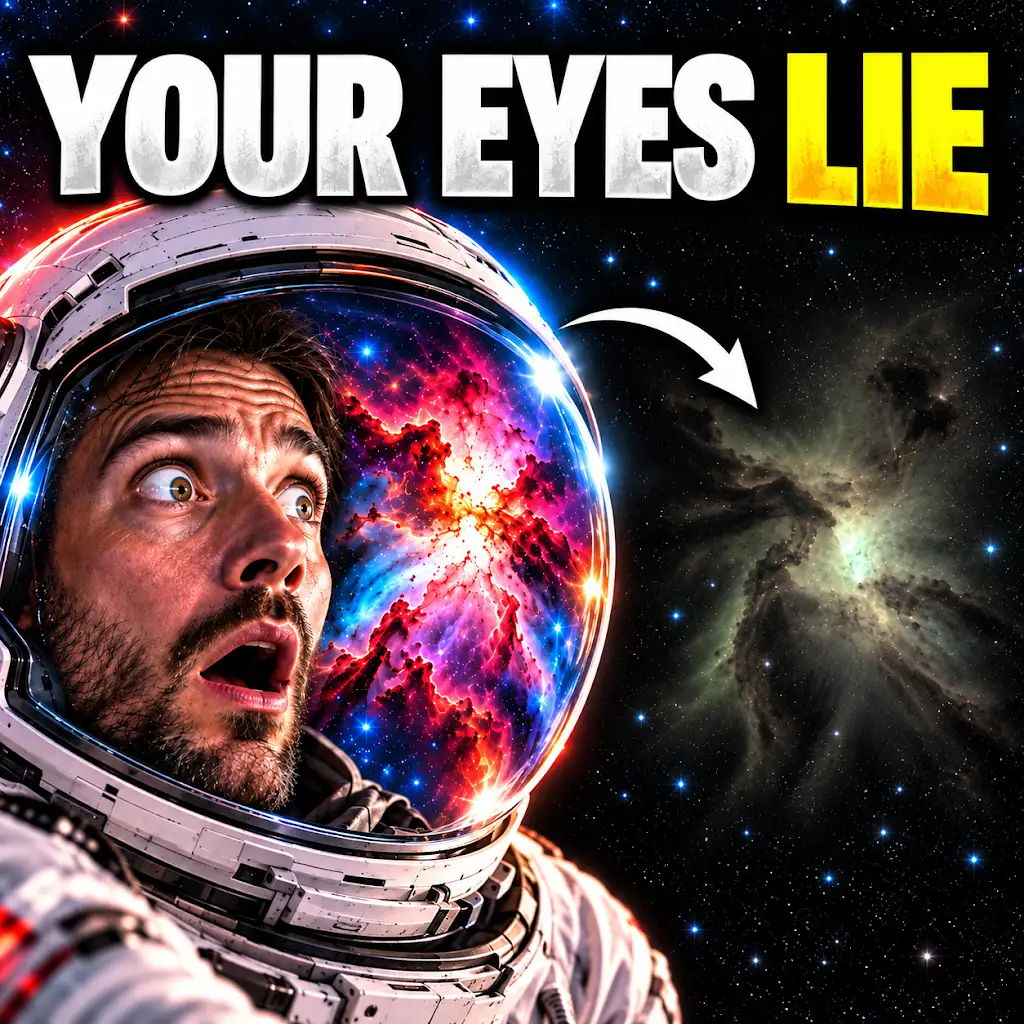
The Space Photos Are Real—But Your Eyes Would See This
FAQs
1. What is color mapping in astronomy?
Color mapping in astronomy is a technique used to represent different wavelengths of light from celestial objects using different colors. This allows astronomers to visualize and analyze complex data in a more intuitive way.
2. Why do astronomers use color mapping?
Astronomers use color mapping to enhance the visual representation of data collected from telescopes and other instruments. By assigning different colors to different wavelengths of light, astronomers can identify patterns, structures, and variations in celestial objects more easily.
3. How does color mapping help astronomers in their research?
Color mapping helps astronomers in their research by providing a clearer and more detailed understanding of the properties and characteristics of celestial objects. It allows them to identify different components, such as gases, dust, and stars, and study their distribution and interactions.
4. What are some common color mapping techniques used in astronomy?
Some common color mapping techniques used in astronomy include assigning visible light wavelengths to the red, green, and blue channels to create true-color images, as well as using false-color mapping to represent non-visible wavelengths, such as infrared or ultraviolet light.
5. Can color mapping reveal information that is not visible to the human eye?
Yes, color mapping can reveal information that is not visible to the human eye, such as infrared or ultraviolet light. By assigning these non-visible wavelengths to visible colors, astronomers can uncover hidden features and phenomena in celestial objects that would otherwise go unnoticed.