The cosmic microwave background (CMB) temperature map stands as one of humanity’s most profound scientific achievements. It is a snapshot of the universe when it was merely 380,000 years old, a baby photograph of the cosmos that reveals crucial insights into its origins, evolution, and ultimate fate. This map, a mosaic of subtle temperature variations across the entire sky, is not just a pretty picture; it’s a treasure trove of cosmological data, allowing scientists to probe fundamental questions about the Big Bang, the composition of the universe, and the nature of gravity. Understanding this map requires delving into the physics of the early universe, the techniques used to observe it, and the profound implications of its observed features.
The Genesis of the Cosmic Microwave Background
The journey to understanding the CMB temperature map begins with the Big Bang theory, the prevailing cosmological model for the universe’s inception. Immediately after the Big Bang, the universe was an incredibly hot, dense, and opaque plasma of elementary particles. Photons, the fundamental particles of light, were constantly scattering off free electrons, much like light scattering off fog. This made the universe opaque, preventing any light from traveling freely. As the universe expanded, it cooled.
The Era of Recombination and Decoupling
A pivotal moment in cosmic history occurred approximately 380,000 years after the Big Bang, a period known as the “recombination epoch.” At this time, the universe had cooled enough for protons and electrons to combine, forming neutral hydrogen atoms. This event dramatically reduced the number of free electrons available to scatter photons. With fewer obstacles, photons could finally travel unimpeded across the vast expanse of space. This transition from an opaque plasma to a transparent neutral gas is known as “decoupling,” and the photons released at this time are what we observe today as the CMB.
Redshifting and the Microwave Spectrum
As the universe continued to expand over billions of years, these ancient photons have been stretched, their wavelengths increasing. This phenomenon is called redshift, a direct consequence of the expansion of space itself. What was once high-energy radiation, likely in the visible or ultraviolet spectrum, has been redshifted to the microwave portion of the electromagnetic spectrum, with a peak wavelength of about 1 millimeter. This is why we call it the Cosmic Microwave Background. The CMB is remarkably uniform in temperature across the entire sky, averaging around 2.725 Kelvin (-270.425 degrees Celsius or -454.765 degrees Fahrenheit). This uniformity is a testament to the hot, dense state of the early universe and the homogeneity of matter at that time.
The Cosmic Microwave Background (CMB) temperature map provides crucial insights into the early universe, revealing information about its formation and evolution. For a deeper understanding of the implications of the CMB and its significance in cosmology, you can explore a related article that delves into the intricacies of this fascinating topic. Check out the article here: CMB Temperature Map Explained.
Observing the CMB: Capturing the Ancient Light
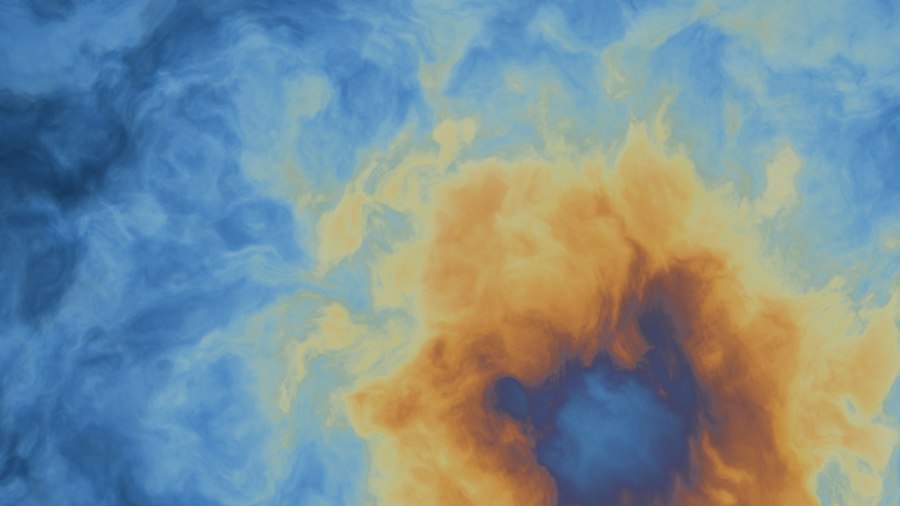
Detecting and mapping the CMB is a remarkable feat of observational cosmology, requiring highly sensitive instruments and sophisticated techniques to filter out foreground emissions from our own galaxy and other sources. The subtle temperature fluctuations, which are key to understanding the universe’s structure, are minuscule – on the order of parts per million – making their detection a significant challenge.
Early Discoveries and Accidental Detection
The existence of the CMB was predicted theoretically by George Gamow, Ralph Alpher, and Robert Herman in the 1940s as a natural consequence of the Big Bang. However, its first observational detection was somewhat accidental. In 1964, Arno Penzias and Robert Wilson, while working at Bell Labs on a microwave receiver, detected a persistent, isotropic excess noise that they could not eliminate. This noise, originating from all directions in the sky, perfectly matched the predictions for the CMB radiation. Their discovery earned them the Nobel Prize in Physics in 1978.
Satellites and Precision Measurements
Since Penzias and Wilson’s serendipitous discovery, numerous ground-based and balloon-borne experiments have been conducted to study the CMB with increasing precision. However, the true revolution in CMB observation came with space-based missions. These missions offer significant advantages by escaping the distorting and absorbing effects of Earth’s atmosphere.
The Cosmic Background Explorer (COBE) satellite, launched in 1989, provided the first detailed map of the CMB and confirmed its blackbody spectrum with unprecedented accuracy. COBE also made the first detection of the tiny temperature anisotropies, the subtle variations that are so crucial.
The Wilkinson Microwave Anisotropy Probe (WMAP), launched in 2001, built upon COBE’s success, delivering significantly higher resolution maps of the CMB anisotropies. WMAP’s data allowed cosmologists to determine the age of the universe, its composition (including the proportions of dark matter and dark energy), and the curvature of space with remarkable precision.
The Planck satellite, launched by the European Space Agency in 2009, represents the pinnacle of CMB observational accuracy to date. Planck provided the most detailed and sensitive maps of the CMB ever produced, allowing scientists to study the polarization of the CMB and probe even finer details of the early universe, refining our understanding of fundamental cosmological parameters.
Decoding the Temperature Fluctuations: Seeds of Cosmic Structure
The near-uniformity of the CMB is a powerful piece of evidence for the Big Bang, but it is the subtle temperature variations – the anisotropies – that hold the key to understanding how the large-scale structures we observe today, like galaxies and galaxy clusters, formed. These fluctuations are not random; they represent minute differences in density and temperature in the primordial plasma.
Quantum Fluctuations and Inflation
The prevailing cosmological model suggests that these tiny inhomogeneities originated from quantum fluctuations in the very early universe, during an epoch of rapid expansion known as cosmic inflation. Inflation, a hypothetical period of exponential expansion theorized to have occurred a tiny fraction of a second after the Big Bang, is thought to have stretched these quantum ripples to macroscopic scales. As the universe expanded and cooled, these over-dense regions became slightly hotter, and under-dense regions became slightly cooler, imprinting these variations onto the CMB.
The Physics of Acoustic Oscillations
The CMB temperature map is essentially a snapshot of these density fluctuations at the time of decoupling. The patterns observed in the map are a result of a complex interplay of gravitational forces and pressure waves. In the primordial plasma, gravity tried to pull matter together, while the pressure from photons pushed it apart. These competing forces created “acoustic oscillations” within the plasma. These oscillations caused regions of slightly higher density to compress and then expand, and regions of slightly lower density to expand and then contract, much like sound waves traveling through a medium.
The CMB temperature map reveals the characteristic imprint of these acoustic oscillations. Areas that were slightly denser experienced stronger gravitational pull, leading to slightly higher temperatures in the CMB. Conversely, areas that were slightly less dense, or where the oscillations had reached a peak expansion, appeared slightly cooler. The angular size of these hot and cold spots on the sky is directly related to the characteristic scales of these oscillations and provides invaluable information about the physics of the early universe.
Cosmological Parameters from the CMB Map
The precise pattern of temperature fluctuations in the CMB map allows cosmologists to determine a suite of fundamental cosmological parameters that describe the universe. By analyzing the power spectrum of these fluctuations – a statistical representation of the amplitude of fluctuations at different angular scales – scientists can constrain models of the universe.
Age, Geometry, and Composition of the Universe
One of the most significant achievements of CMB observations, particularly from WMAP and Planck, has been the precise determination of the age of the universe, estimated to be approximately 13.8 billion years. The CMB map also provides information about the geometry of the universe. If the universe is spatially flat, open, or closed, this will be reflected in the characteristic size of the observed temperature fluctuations. Current data strongly suggest that the universe is remarkably flat.
Furthermore, the CMB map allows for a precise measurement of the universe’s composition. By analyzing the relative heights and positions of the peaks in the CMB power spectrum, cosmologists can determine the proportions of:
- Baryonic Matter: This is the ordinary matter that makes up stars, planets, and ourselves. It constitutes about 4.9% of the total mass-energy of the universe.
- Dark Matter: This is a mysterious, non-luminous form of matter that interacts gravitationally but does not emit, absorb, or reflect light. It accounts for approximately 26.8% of the universe’s mass-energy. Its presence is inferred from its gravitational effects on visible matter and its role in structure formation.
- Dark Energy: This is an even more enigmatic entity that is driving the accelerated expansion of the universe. It makes up about 68.3% of the universe’s mass-energy. The CMB provides strong evidence for its existence and influence.
The Hubble Constant and its Tension
The CMB data also provide an independent measurement of the Hubble constant ($H_0$), which describes the rate at which the universe is expanding today. This measurement, derived from the early universe conditions revealed by the CMB, is around 67.4 kilometers per second per megaparsec. However, this value is in tension with measurements of $H_0$ derived from observations of the local universe (e.g., using supernovae and Cepheid variables), which yield a higher value of around 73.0 kilometers per second per megaparsec. This “Hubble tension” is one of the most pressing puzzles in modern cosmology, suggesting that either our understanding of the early universe is incomplete, our measurements of the local universe are flawed, or there are new physical phenomena at play.
The Cosmic Microwave Background (CMB) temperature map provides crucial insights into the early universe, and for those looking to delve deeper into this fascinating topic, an informative article can be found at Freaky Science. This resource offers a comprehensive explanation of the significance of the CMB and its implications for our understanding of cosmic evolution. By exploring the intricate details of the temperature fluctuations captured in the map, readers can gain a better appreciation of how these patterns relate to the formation of galaxies and the overall structure of the universe.
Unveiling the Secrets of Inflation and Beyond
| Metric | Description | Typical Value | Unit |
|---|---|---|---|
| Temperature Fluctuations | Variations in the Cosmic Microwave Background temperature across the sky | ±0.0002 | Kelvin (K) |
| Average Temperature | Mean temperature of the CMB radiation | 2.725 | Kelvin (K) |
| Angular Scale | Size of temperature fluctuation features on the sky | ~1 | Degree (°) |
| Power Spectrum Peak | Multipole moment where the first acoustic peak occurs in the CMB power spectrum | ~220 | Multipole moment (l) |
| Polarization | Degree of polarization in the CMB radiation | ~10 | Microkelvin (μK) |
| Redshift of Last Scattering | Epoch when CMB photons last scattered off matter | ~1100 | Redshift (z) |
The CMB temperature map is not just a measure of the universe’s past; it’s also a powerful probe of its most fundamental beginnings and a guide to future discoveries. The detailed analysis of the CMB anisotropies has provided strong evidence for the theory of cosmic inflation and continues to challenge and refine our cosmological models.
Evidence for Cosmic Inflation
The statistical properties of the CMB anisotropies, such as their nearly scale-invariant power spectrum and their Gaussian distribution, are precisely what is predicted by the simplest models of cosmic inflation. Inflation elegantly explains the homogeneity and flatness of the universe, as well as the origin of the primordial density fluctuations. While direct detection of the gravitational waves produced during inflation, which would leave a specific imprint called B-modes in the CMB polarization, remains an active area of research, the temperature anisotropies themselves provide compelling indirect support for this pivotal period in the universe’s history.
Testing Fundamental Physics
The CMB acts as a unique laboratory for testing fundamental physics. The precise measurements of the CMB’s properties allow scientists to set stringent limits on alternative cosmological models, the properties of neutrinos, and the existence of exotic particles. For instance, the CMB constrains the total mass of neutrinos, a fundamental particle that interacts very weakly with matter.
Polarization and Future Frontiers
Beyond temperature, the CMB also exhibits polarization – the orientation of the electric field of the light waves. Measuring the polarization of the CMB, particularly the B-mode polarization, is a key goal of current and future CMB experiments. Detecting primordial B-modes would provide direct evidence for gravitational waves generated during inflation, offering an unprecedented glimpse into the physics of the universe at its earliest moments. Furthermore, studying the interaction of CMB photons with intervening matter through effects like the Sunyaev-Zel’dovich effect can reveal information about the distribution of dark matter and the properties of galaxy clusters. The CMB temperature map, therefore, is not an endpoint but a continuing source of discovery, pushing the boundaries of our understanding of the cosmos and our place within it.

The Universe’s Cold Spot Has an Explanation. It’s Not Enough.
FAQs
What is the CMB temperature map?
The CMB temperature map is a map of the Cosmic Microwave Background radiation, which is the afterglow of the Big Bang. It shows the variations in temperature across the universe.
How is the CMB temperature map created?
The CMB temperature map is created using data collected by satellites such as the Planck satellite. These satellites measure the temperature of the CMB radiation across the sky and create a detailed map of these temperature fluctuations.
What does the CMB temperature map tell us about the early universe?
The CMB temperature map provides valuable insights into the early universe, revealing the seeds of cosmic structure formation. It shows the tiny temperature fluctuations that eventually grew into the galaxies and galaxy clusters we see today.
What are the implications of the CMB temperature map for cosmology?
The CMB temperature map helps cosmologists test and refine theories about the origin and evolution of the universe. It provides crucial evidence for the Big Bang theory and helps determine the composition and geometry of the universe.
How does the CMB temperature map support the theory of cosmic inflation?
The CMB temperature map supports the theory of cosmic inflation by showing the uniformity and isotropy of the CMB radiation on large scales. This supports the idea that the universe underwent a rapid period of expansion in its early history.