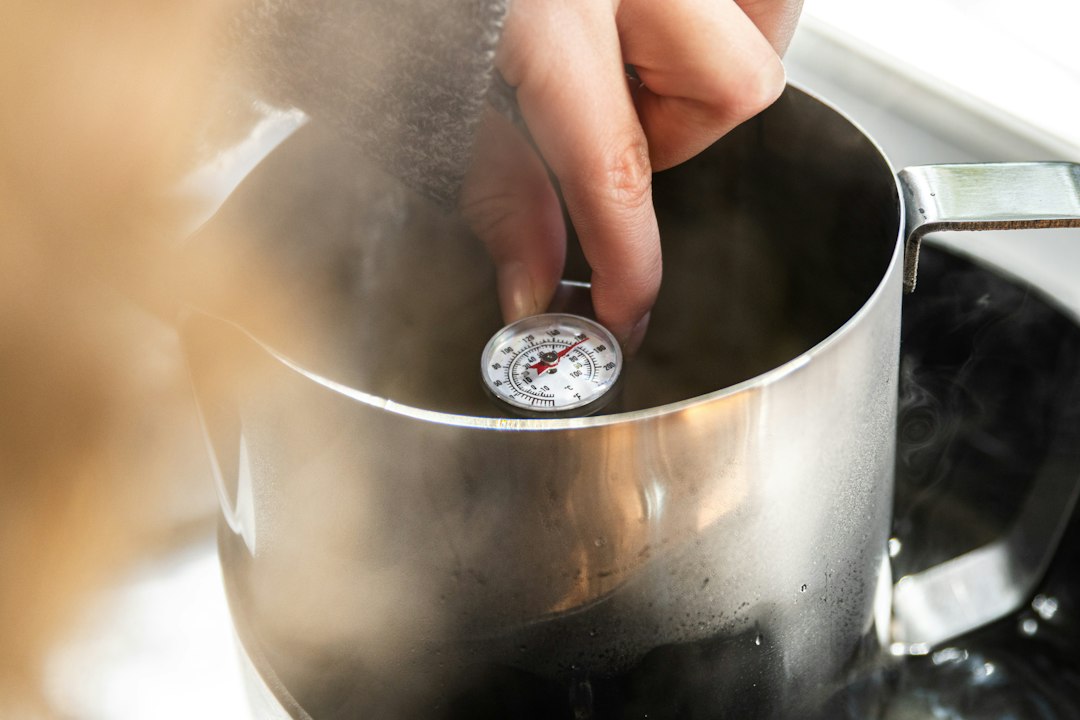
The Thermometer Experiment: Measuring Temperature Changes in Water
Understanding the Basics of Temperature Measurement
The ability to accurately measure temperature is fundamental to countless scientific disciplines and everyday applications. From cooking and weather forecasting to advanced research in physics and chemistry, temperature serves as a critical indicator of the thermal energy present in a substance. The instrument most commonly employed for this task is the thermometer, a device that quantifies heat intensity through various physical principles. This article delves into a common and insightful experiment: measuring temperature changes in water using a thermometer, exploring the underlying concepts and practical execution.
The Role of the Thermometer
At its core, a thermometer works by exploiting the relationship between temperature and a physical property of a material that changes predictably with heat. The most ubiquitous type, the liquid-in-glass thermometer, relies on the thermal expansion of a liquid, typically mercury or colored alcohol, contained within a sealed glass tube. As the temperature increases, the liquid expands and rises within the narrow bore of the tube, indicating a higher temperature on a calibrated scale. Conversely, a decrease in temperature causes the liquid to contract and fall.
Other types of thermometers exist, each utilizing different physical phenomena. Bimetallic thermometers, for instance, consist of two different metals with varying rates of thermal expansion bonded together. As temperature changes, the differential expansion causes the strip to bend, which can be mechanically linked to a pointer. Digital thermometers often employ thermistors or thermocouples, which are electronic components whose electrical resistance or voltage output changes measurably with temperature. For the purposes of this experiment, we will focus on the classic liquid-in-glass thermometer due to its simplicity and visual clarity.
Principles of Thermal Energy and Heat Transfer
Before embarking on the experiment, it’s crucial to grasp the concepts of thermal energy and heat transfer. Thermal energy is the total kinetic and potential energy of the particles within a substance. Temperature, on the other hand, is a measure of the average kinetic energy of these particles. When heat is added to a substance, its particles move faster, increasing its thermal energy and, consequently, its temperature. Conversely, when heat is removed, particle motion slows, thermal energy decreases, and the temperature drops.
Heat transfer is the process by which thermal energy moves from one place to another. There are three primary mechanisms of heat transfer: conduction, convection, and radiation. Conduction is the transfer of heat through direct contact between particles. In solids, this occurs as vibrations are passed from one atom to the next. In liquids and gases, it involves collisions between molecules. Convection is the transfer of heat through the movement of fluids (liquids or gases). Warmer, less dense fluid rises, while cooler, denser fluid sinks, creating circulating currents that distribute heat. Radiation is the transfer of heat through electromagnetic waves, such as infrared radiation emitted by the sun or a hot object. In the context of water temperature changes, all three mechanisms can play a role, though convection is often the most prominent in bulk water.
In exploring the fascinating world of temperature measurement, a related article that delves into various thermometer experiments can be found at Freaky Science. This resource provides insights into how different liquids respond to temperature changes, making it an excellent complement to any experiment involving thermometers in water. For more information, you can read the article here: Freaky Science.
Designing the Water Heating and Cooling Experiment
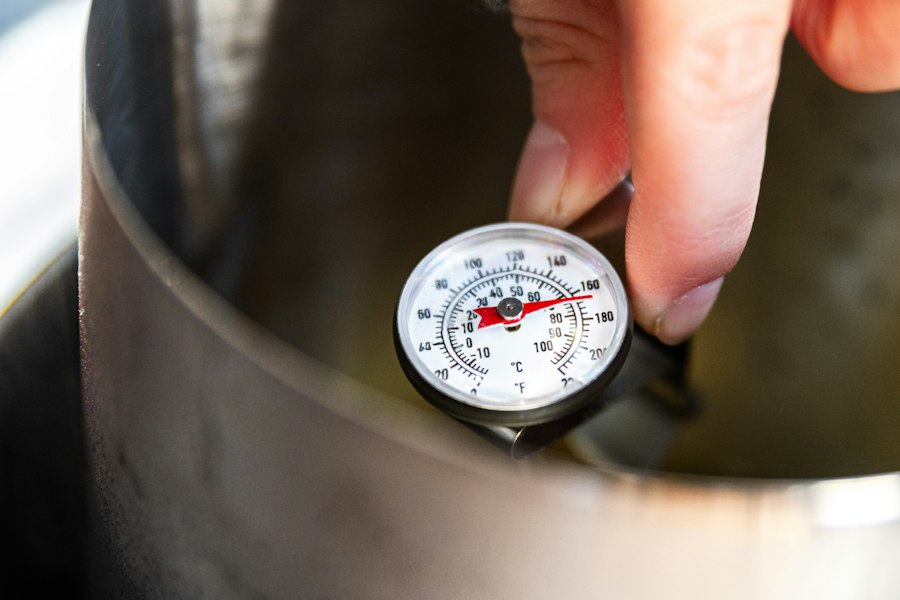
This experiment aims to observe and quantify the changes in water temperature under different conditions. The fundamental setup involves a container of water, a heat source (or a cooling method), and a thermometer. The variability lies in the method of heating or cooling, the initial temperature of the water, and the duration of the process. A well-designed experiment will allow for clear observations and the collection of meaningful data.
Selecting the Experimental Setup
For a straightforward demonstration of temperature change, a simple beaker or glass is sufficient as the container for the water. A standard laboratory thermometer or even a household digital thermometer can be used for measurement. The choice of heat source will depend on the desired rate of temperature change and available resources. Options include a hot plate, a Bunsen burner (with appropriate safety precautions), or simply hot water from a tap. For cooling, placing the container in a refrigerator or an ice bath are practical methods. It is important to ensure that the thermometer is not in direct contact with the heat source itself, which could lead to inaccurate readings due to localized heating of the thermometer bulb.
Identifying Key Variables
In any experiment, it is crucial to distinguish between independent, dependent, and controlled variables. In this thermometer experiment, the independent variable is the factor that the experimenter manipulates. This could be the amount of heat added, the duration of heating, the initial temperature of the water, or the presence of a cooling agent. The dependent variable is what is measured and is expected to change in response to the independent variable. In this case, it is the temperature of the water, as indicated by the thermometer. Controlled variables are factors that are kept constant throughout the experiment to ensure that only the independent variable is affecting the dependent variable. These might include the volume of water, the type of container, the ambient room temperature, and the type of thermometer used.
Conducting the Heating Phase
The heating phase of the experiment involves introducing thermal energy to the water and observing its temperature rise. This is often the most dynamic part of the experiment, showcasing the direct impact of adding heat. Careful observation and accurate recording of temperature readings are paramount during this stage.
The Process of Adding Heat
To begin the heating phase, a measured volume of water is placed into the container. The initial temperature of the water is recorded. Then, the heat source is applied. For instance, if using a hot plate, the beaker of water is placed on the hot plate, and the heat is turned on to a moderate setting. It is important to avoid boiling the water unless that is a specific objective, as the boiling point represents a plateau where the temperature remains constant despite continued heat input due to the energy being used for the phase change from liquid to gas. Stirring the water occasionally with a non-metallic stirring rod can help ensure uniform heating and prevent localized hot spots, allowing for a more accurate representation of the bulk water temperature.
Recording Temperature Readings
As the water heats, the thermometer’s reading will steadily increase. Temperature readings should be taken at regular intervals, for example, every 30 seconds or every minute, depending on the rate of heating. It is essential to record both the time and the corresponding temperature. For example, a data table could be created with columns for “Time (minutes)” and “Temperature (°C)”. This systematic recording allows for the creation of a temperature-time graph, which visually represents the heating process and facilitates analysis of the rate of temperature change. For instance, an initial rapid increase in temperature might be observed, followed by a slower rate as the water approaches boiling or as heat is lost to the surroundings.
Observing the Cooling Phase
Once the heating phase is complete, or at any point where a temperature decrease is desired, the cooling phase is initiated. This demonstrates the principle that thermal energy can also be removed from a substance, leading to a decrease in its temperature. Similar to the heating phase, careful observation and recording are essential.
Initiating the Cooling Process
To initiate cooling, the heat source is removed. If the water was heated in a beaker on a hot plate, simply turning off the hot plate and removing the beaker will begin the cooling process. If the objective is to cool the water more rapidly, the beaker can be placed in a larger container filled with cold water (an ice bath) or placed in a refrigerator. Again, stirring can be beneficial to ensure uniform cooling, especially when using an external cooling method like an ice bath. The stirring action helps to bring warmer water molecules into contact with the cooling medium.
Monitoring Temperature Drop
As the water cools, the thermometer reading will decrease. Similar to the heating phase, temperature readings should be taken at regular intervals and recorded alongside the corresponding time. A separate data table or continuation of the previous one can be used. This data will allow for the plotting of a cooling curve. Unlike the heating curve, which often shows a steep initial rise, the cooling curve typically depicts a more gradual decline in temperature. The rate of cooling will depend on factors such as the temperature difference between the water and its surroundings, the surface area of the water exposed to the air, and the effectiveness of any cooling aids used.
In exploring the fascinating world of temperature measurement, a related article discusses the innovative thermometer experiment using water to demonstrate thermal expansion. This experiment not only illustrates the principles of thermodynamics but also engages students in hands-on learning. For more insights on this topic, you can read the full article here.
Analyzing and Interpreting Results
| Time (minutes) | Water Temperature (°C) | Thermometer Reading (°C) | Observation |
|---|---|---|---|
| 0 | 25 | 25 | Initial temperature, room temperature water |
| 5 | 35 | 34.8 | Water warming up |
| 10 | 45 | 44.5 | Temperature rising steadily |
| 15 | 55 | 54.7 | Approaching mid-range temperature |
| 20 | 65 | 64.9 | Water getting hot |
| 25 | 75 | 74.8 | Near boiling point |
| 30 | 85 | 84.6 | High temperature |
| 35 | 95 | 94.9 | Almost boiling |
| 40 | 100 | 99.8 | Boiling point reached |
The collected data from both the heating and cooling phases are invaluable for understanding the thermal behavior of water. By analyzing the recorded temperatures and times, one can draw conclusions about the rate of temperature change, the influence of external factors, and the fundamental principles of heat transfer.
Constructing and Examining Graphs
The most effective way to visualize and analyze the temperature changes is to plot the data on a graph. A time-temperature graph, with time on the x-axis and temperature on the y-axis, is ideal. Two distinct curves will emerge: one representing the heating process and another representing the cooling process. Examining these curves allows for the identification of trends. For example, one can observe the initial rate of temperature increase during heating and compare it to the rate of temperature decrease during cooling. The steepness of the curves indicates how quickly the temperature is changing. If the experiment involved varying the amount of heat or the cooling method, the graphs can be compared to demonstrate the effect of these independent variables on the dependent variable (temperature).
Discussing Factors Affecting Temperature Change
Several factors can influence the rate and magnitude of temperature changes in water. The specific heat capacity of water, which is the amount of heat required to raise the temperature of one gram of water by one degree Celsius, is a key property. Water has a relatively high specific heat capacity, meaning it takes a significant amount of energy to change its temperature. The volume of water also plays a role; larger volumes will take longer to heat or cool than smaller volumes, assuming the same amount of heat is added or removed. The surface area exposed to the environment influences heat loss or gain through convection and evaporation. The initial temperature of the water will also affect the rate of change, particularly during cooling, as the temperature difference between the water and its surroundings drives the heat transfer. Environmental factors such as ambient room temperature, air currents, and humidity can also contribute to heat loss or gain, affecting the cooling and heating rates, respectively. Understanding these factors allows for a more comprehensive interpretation of the experimental results and provides insights into the real-world applications of thermodynamics. For example, the high specific heat capacity of water makes it an excellent coolant, as it can absorb a large amount of heat without a significant temperature increase, which is why it is used in car radiators and in industrial cooling systems. Similarly, its ability to retain heat is why bodies of water can moderate local climates.
Why Hot Water Freezes Faster Than Cold (The Mpemba Effect)
FAQs
What materials are needed for a thermometer experiment with water?
For a thermometer experiment with water, you will need a thermometer, a container to hold the water, water, a heat source (such as a stove or Bunsen burner), and a timer.
How can the thermometer be used to measure the temperature of water in the experiment?
To measure the temperature of water in the experiment, the thermometer should be placed in the water, ensuring that the sensor tip is fully submerged. Allow the thermometer to stabilize for a few moments before recording the temperature reading.
What is the purpose of conducting a thermometer experiment with water?
The purpose of conducting a thermometer experiment with water is to demonstrate how a thermometer can accurately measure the temperature of a substance, in this case, water. It also helps to understand the concept of thermal equilibrium and how heat is transferred.
How can the thermometer experiment with water be used to study heat transfer?
The thermometer experiment with water can be used to study heat transfer by observing how the temperature of the water changes when heat is applied. By measuring the temperature at regular intervals, one can analyze how heat is transferred from the heat source to the water.
What safety precautions should be taken when conducting a thermometer experiment with water?
When conducting a thermometer experiment with water, it is important to handle the heat source with care to avoid burns. Ensure proper ventilation if using a Bunsen burner. Additionally, always follow safety guidelines when working with heat sources and hot liquids.