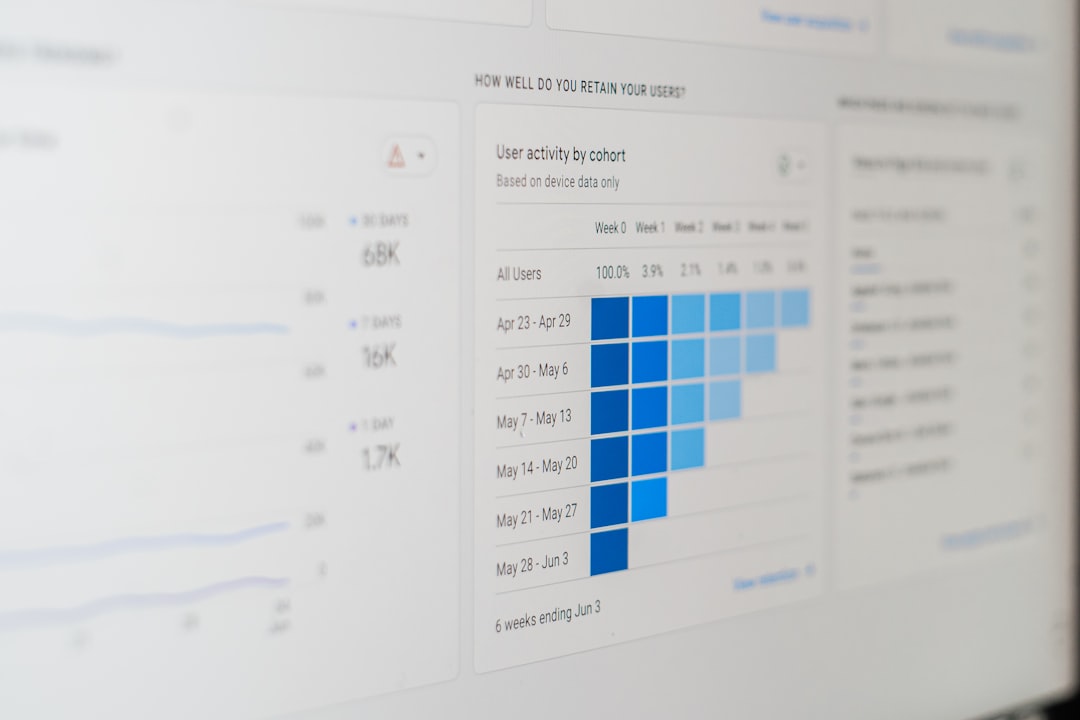
Monitoring climate tripwires with open dashboards offers a powerful mechanism for understanding and responding to critical thresholds in the Earth’s climate system. These “tripwires,” often referred to as tipping points, represent abrupt and often irreversible shifts in ecological or climatic processes. When crossed, they can trigger cascading effects, leading to significant and widespread consequences for both natural systems and human societies. Open dashboards, in this context, act as transparent, accessible windows into the data and analyses that track these critical junctures.
Climate tripwires, or tipping points, are thresholds beyond which a system shifts from one stable state to another, often with considerable difficulty or impossibility of returning to the original state. These are not gradual, linear changes; rather, they are points of no return. Imagine a glass of water precariously balanced on the edge of a table. A slight nudge might cause it to wobble, but it remains on the table. However, push it a millimeter further, and it will inevitably fall, shattering on the floor, a state from which the glass cannot be easily reassembled. Climate tripwires function similarly for Earth systems.
Understanding Tipping Elements
The Earth’s climate system is comprised of numerous interconnected components, some of which are particularly susceptible to abrupt shifts. These are known as tipping elements. Examples include:
Ice Sheets and Glaciers
The Greenland and Antarctic ice sheets, along with mountain glaciers worldwide, are significant tipping elements. Their melting is not only a consequence of warming but also a driver of future warming and sea-level rise. Once a critical melt rate is reached, positive feedbacks can accelerate the process, even if global temperatures were to stabilize.
Ocean Circulation Patterns
Large-scale ocean currents, such as the Atlantic Meridional Overturning Circulation (AMOC), play a crucial role in regulating global climate by transporting heat. Disruptions to these currents, potentially caused by freshwater influx from melting ice, could lead to dramatic regional climate shifts, particularly in Europe.
Amazon Rainforest
The Amazon rainforest, a vast carbon sink and regulator of regional rainfall, is threatened by deforestation and climate change. A tipping point could lead to a savanna-like state, releasing massive amounts of stored carbon and altering weather patterns across South America.
Permafrost
Vast stores of frozen organic matter in Arctic permafrost contain significant amounts of greenhouse gases like methane and carbon dioxide. As permafrost thaws, these gases are released into the atmosphere, creating a positive feedback loop that amplifies warming.
The Nature of Non-Linear Change
A Defining characteristic of tripwire events is their non-linear nature. Small, seemingly insignificant increments in warming or other stressors can, upon reaching a threshold, trigger disproportionately large and rapid changes. This is in contrast to many gradual, linear trends observed in other environmental indicators. The analogy here might be a dam holding back a vast reservoir of water. While small leaks might be managed, a critical breach can lead to a catastrophic flood that overwhelms all mitigation efforts downstream.
Irreversibility and Hysteresis
Once a climate tripwire is crossed, the return to the original state is often impossible or requires a significant reversal of the initial drivers, far beyond the point at which the shift occurred. This phenomenon is known as hysteresis. Think of fraying a piece of fabric. You can sew it up, but the mend will always be visible, and the fabric’s integrity is permanently altered. Reversing a climate shift after a tipping point has been crossed is akin to trying to un-fray that fabric.
In the quest for effective climate monitoring, the concept of open dashboards for climate tripwires has gained significant attention. These dashboards serve as vital tools for tracking critical environmental indicators and alerting stakeholders to potential climate-related risks. For a deeper understanding of this topic, you can explore a related article that discusses the implementation and benefits of such dashboards in detail. Check it out here: Open Dashboards for Climate Tripwires.
The Role of Open Dashboards in Monitoring
Open dashboards serve as crucial tools for visualizing, tracking, and communicating the status of climate tripwires. They democratize access to complex scientific data, enabling a broader audience, from policymakers to concerned citizens, to engage with critical climate information.
Transparency and Accessibility of Data
Open dashboards are built on the principle of making scientific data and analysis readily available to the public. This transparency is vital for fostering trust and informed decision-making. Instead of data being locked away in scientific journals or proprietary databases, it is presented in an accessible format, often with interactive visualizations.
Data Sources and Integration
These dashboards typically integrate data from a variety of sources, including satellite observations, ground-based sensors, climate models, and historical records. The aggregation and synthesis of this diverse information provide a comprehensive picture of the Earth’s evolving climate.
Visualization of Complex Trends
The power of a dashboard lies in its ability to abstract complex datasets into understandable visualizations. Line graphs showing temperature anomalies over time, maps illustrating changes in ice extent, and charts depicting the concentration of atmospheric gases are just some examples of how raw data is transformed.
Real-time and Near Real-time Monitoring
Many open dashboards strive to provide the most up-to-date information possible. This allows for the continuous monitoring of indicators sensitive to tripwire thresholds. The ability to observe trends as they unfold is crucial for early warning systems.
Tracking Key Indicators
Dashboards often focus on specific indicators directly linked to potential tipping points. This could include:
Arctic Sea Ice Extent
Monitoring the year-round and seasonal extent of Arctic sea ice provides insights into the health of this critical region and its potential feedback loops.
Ocean Heat Content
Changes in the thermal energy stored in the oceans are a good indicator of global warming and can influence ocean circulation patterns.
Forest Cover and Degradation
Satellite imagery can track changes in forest cover, particularly in vital ecosystems like the Amazon, highlighting the risk of deforestation-induced tipping points.
Early Warning Systems
By continuously monitoring these indicators, open dashboards can contribute to the development of early warning systems. While predicting the exact moment a tripwire will be crossed is challenging, these systems can identify when a system is approaching a dangerous threshold, allowing for more proactive responses.
Empowering Stakeholders
Open dashboards empower a wide range of stakeholders by providing them with the information needed to understand the risks and advocate for action.
Informing Policy Decisions
Policymakers can utilize the data presented on these dashboards to understand the urgency and scale of climate change impacts, informing the development and implementation of climate policies.
Engaging the Public
For the general public, dashboards offer a way to connect with the reality of climate change on a tangible level. This can foster a greater sense of urgency and motivate individual and collective action.
Supporting Scientific Research
Researchers can use open dashboards as starting points for their investigations, identifying areas of concern or hypotheses to explore further within more specialized datasets.
Challenges in Monitoring Climate Tripwires

Despite the promise of open dashboards, monitoring climate tripwires presents significant scientific and practical challenges. These complexities often mean that outright predictions are difficult, and the focus remains on risk assessment and approaching thresholds.
Defining and Identifying Tripwires
Precisely defining the exact threshold for a climate tripwire, and identifying when a system is unequivocally approaching it, remains a significant scientific challenge. Climate systems are highly complex, with numerous interacting variables.
Scientific Uncertainty and Modeling Limitations
Climate models are sophisticated tools but are not perfect representations of reality. They have inherent limitations in their ability to capture certain complex processes and predict the exact timing and magnitude of abrupt shifts.
Parameterization Difficulties
The accurate representation of sub-grid scale processes within climate models, such as cloud formation or permafrost dynamics, often requires complex parameterizations, which introduce further uncertainties.
Ensemble Modeling Approaches
To address some of these limitations, scientists often use ensemble modeling, running multiple simulations with slightly different parameters or initial conditions. Analyzing the range of outcomes from these ensembles can provide a more robust estimate of potential future changes and associated risks.
Data Sparsity and Quality
While data collection has improved dramatically, there are still regions and parameters where data is sparse or of variable quality. This is particularly true for certain remote areas or for historical records predating extensive satellite monitoring.
Remote Sensing Limitations
While satellites provide invaluable global coverage, they can face limitations due to cloud cover, sensor calibration issues, and the resolution of the data collected.
Ground-Truth Verification
Independent ground-truth verification of satellite data is crucial for ensuring accuracy. In areas with limited infrastructure and fewer ground stations, this verification process can be more challenging.
Communicating Complex Information Effectively
Translating complex scientific findings about tipping points into language that is understandable and actionable for a broad audience is a significant communication challenge.
Avoiding Alarmism Without Downplaying Risks
The delicate balance between conveying the seriousness of potential tipping points without resorting to sensationalism or alarmism is crucial for maintaining public engagement and trust.
Tailoring Information to Different Audiences
Different stakeholders have different needs and levels of understanding. Dashboards need to be designed to cater to a variety of audiences, from expert scientists to the general public.
The Dynamic Nature of Climate Systems
Climate systems are not static. They are constantly evolving, and new feedback loops or interactions can emerge. This means that monitoring efforts must be adaptive and responsive to new scientific understanding.
Evolving Scientific Understanding
As research progresses, scientists continually refine their understanding of climate processes and tipping points. Dashboards need to be updated to reflect this evolving scientific knowledge.
Interconnectedness of Tipping Elements
It is increasingly understood that climate tipping elements are not isolated but are interconnected. The crossing of one tripwire can potentially increase the risk of crossing others, creating cascading effects that are difficult to predict and manage.
Designing Effective Open Dashboards for Climate Tripwires

Creating effective open dashboards requires careful consideration of design principles, user needs, and the scientific context. The goal is to make complex information intuitive, engaging, and actionable.
User-Centric Design Principles
Effective dashboards are designed with the end-user in mind, ensuring that the information presented is relevant, accessible, and easy to understand.
Intuitive Navigation and User Interface
The layout and navigation of a dashboard should be straightforward, allowing users to quickly find the information they are looking for without a steep learning curve.
Clear Hierarchies and Layouts
Information should be organized in a logical hierarchy, with clear headings, subheadings, and visual cues to guide the user through the data.
Interactive Elements and Drill-Down Capabilities
Users should be able to interact with the data, such as zooming into specific regions or time periods, and drill down into more detailed information if desired.
Visual Communication Best Practices
The effective use of visual elements is paramount in conveying complex data. This includes employing appropriate charts, graphs, and maps.
Appropriate Chart Types
Selecting the right chart type for the data being presented is crucial. For example, line graphs are ideal for showing trends over time, while maps are effective for displaying spatial variations.
Color Palettes and Accessibility
The choice of color palettes should be considered carefully for both aesthetic appeal and accessibility, ensuring that the dashboard is usable by individuals with color vision deficiencies.
Tailoring Content to Specific Tripwires
While a general climate dashboard can be useful, specialized dashboards focusing on specific tipping elements can provide deeper insights and more targeted information.
Dedicated Sections for Key Tipping Elements
Dashboards can feature dedicated sections for prominent tipping elements like the Arctic, Amazon rainforest, or permafrost.
Specific Indicators per Tipping Element
Within each section, relevant indicators should be displayed. For the Arctic, this might include sea ice extent, surface temperature, and Arctic amplification.
Contextual Information and Explanations
Beyond raw data, dashboards should provide context and explanations to help users understand what the data means.
Explanations of Scientific Concepts
Brief, accessible explanations of scientific concepts related to the tipping element, such as positive feedback loops or ocean currents, can greatly enhance understanding.
Links to Further Resources
Providing links to relevant scientific reports, research papers, and authoritative sources empowers users to delve deeper into the subject matter.
Fostering Data Interactivity and Exploration
Encouraging users to actively explore the data can lead to greater engagement and understanding.
Interactive Maps and Time Series Analysis
Allowing users to manipulate maps and analyze time series data interactively can reveal patterns and trends that might otherwise be overlooked.
Georeferenced Data Visualization
Presenting data on interactive maps allows users to visualize geographical differences and changes over time in a spatially relevant manner.
Data Download and API Access
For researchers and developers, providing options to download data or access it via an API can foster further analysis and the development of new applications.
Ensuring Credibility and Trustworthiness
The credibility of an open dashboard is paramount for its effectiveness. This is built on transparency about data sources, methodologies, and acknowledging uncertainties.
Clear Attribution of Data Sources
All data used in the dashboard should be clearly attributed to its source, including the scientific institutions or agencies responsible for its collection and processing.
Open Methodologies and Code
Where possible, making the methodologies and code used for data processing and visualization publicly available can further enhance transparency and allow for peer review.
Acknowledging Scientific Uncertainty
It is crucial to acknowledge the inherent uncertainties in climate science and the limitations of current models. Presenting this uncertainty transparently builds trust.
Explaining Confidence Intervals and Probabilities
Where appropriate, illustrating confidence intervals or probabilities associated with projections can help users understand the range of possible outcomes.
Open dashboards for climate tripwires are becoming increasingly important as we seek to monitor and respond to environmental changes effectively. A related article discusses innovative approaches to visualizing climate data, which can enhance our understanding of these critical indicators. For more insights on this topic, you can read the article at Freaky Science, where they explore how technology is shaping our response to climate challenges.
The Strategic Imperative of Monitoring Climate Tripwires
| Dashboard Name | Metric | Current Value | Threshold (Tripwire) | Status | Last Updated |
|---|---|---|---|---|---|
| Global Temperature Tracker | Average Global Temperature (°C) | 1.2 | 1.5 | Normal | 2024-06-01 |
| Arctic Ice Monitor | Arctic Sea Ice Extent (million km²) | 4.5 | 3.5 | Warning | 2024-06-01 |
| CO2 Concentration Dashboard | Atmospheric CO2 (ppm) | 420 | 450 | Normal | 2024-06-01 |
| Sea Level Rise Tracker | Global Sea Level Rise (mm) | 90 | 100 | Normal | 2024-06-01 |
| Deforestation Alert System | Annual Deforestation Rate (km²) | 8500 | 10000 | Normal | 2024-06-01 |
Monitoring climate tripwires is not merely an academic exercise; it is a strategic imperative for navigating the complex challenges of a changing planet. The insights gained from open dashboards can inform proactive adaptation, drive mitigation efforts, and foster a more resilient future.
Informing Proactive Adaptation Strategies
Understanding the proximity to climate tripwires allows societies to develop and implement adaptation strategies before irreversible changes occur. This is akin to reinforcing a sea wall before a storm surge, rather than waiting for the floodwaters to rise.
Identifying Vulnerable Regions and Systems
Dashboards can highlight regions and ecosystems that are particularly vulnerable to crossing tipping points, enabling targeted adaptation efforts.
Early Identification of Climate Risks
By providing early warnings of approaching thresholds, dashboards enable authorities to prioritize resources and develop contingency plans.
Developing Climate-Resilient Infrastructure
The insights from tripwire monitoring can inform the design and construction of infrastructure that is more resilient to the impacts of abrupt climate shifts.
Driving Global Mitigation Efforts
The stark visualization of approaching tipping points can serve as a powerful catalyst for global mitigation efforts. The understanding that certain actions have irreversible consequences can underscore the urgency of reducing greenhouse gas emissions.
Underscoring the Urgency of Emissions Reductions
Seeing the potential for abrupt and catastrophic changes can galvanize political will and public support for ambitious climate action.
The Concept of “Lock-in” Effects
Monitoring tripwires helps illustrate the concept of climate “lock-in,” where delays in action can lead to a future where warming is harder to reverse, even with significant emission cuts.
Policy Development and International Cooperation
The data presented on open dashboards can provide a common, evidence-based foundation for policy development and foster international cooperation on climate mitigation.
Promoting Public Awareness and Engagement
Open dashboards play a vital role in raising public awareness and fostering a sense of shared responsibility for addressing climate change. When individuals can see and understand the risks, they are more likely to engage in solutions.
Educating the Public on Climate Risks
Dashboards serve as powerful educational tools, demystifying complex climate science and making it accessible to a wider audience.
Fostering Climate Literacy
By providing clear and engaging information, dashboards contribute to a more climate-literate populace, capable of making informed decisions.
Empowering Citizen Action and Advocacy
An informed public is an empowered public. Open dashboards can equip citizens with the knowledge to advocate for stronger climate policies and support sustainable practices.
Building a More Resilient Future
Ultimately, the effort to monitor climate tripwires is an investment in building a more resilient future. By understanding and responding to the Earth’s critical thresholds, we can better safeguard both natural systems and human well-being for generations to come.
Long-Term Planning and Scenario Development
The data from tripwire monitoring can inform long-term planning and the development of various climate scenarios, enabling more robust strategies for the future.
Understanding Cascading Impacts
By monitoring interconnected tipping elements, we can begin to understand and prepare for the cascading impacts of crossing these critical thresholds.
The Ethical Dimension of Monitoring
There is an implicit ethical dimension to this work. By transparently monitoring these potential tipping points, we are bearing witness to the consequences of current actions and providing the information necessary to forge a more responsible path forward, a path that prioritizes the long-term health of our planet and all who depend on it. The vigilant eye of open dashboards on these critical climate junctures offers not just data, but a roadmap for a more sustainable existence.

WARNING: The Ocean Conveyor Belt Is Already Collapsing
FAQs
What are open dashboards for climate tripwires?
Open dashboards for climate tripwires are publicly accessible digital platforms that display real-time data and indicators related to critical climate thresholds. These dashboards help monitor environmental changes that could trigger significant and potentially irreversible impacts on the climate system.
Why are climate tripwires important to monitor?
Climate tripwires represent tipping points in the Earth’s climate system, such as rapid ice melt or deforestation, which can lead to abrupt and severe environmental changes. Monitoring these tripwires is crucial for early warning and informed decision-making to mitigate or adapt to climate risks.
Who typically develops and maintains these open dashboards?
Open dashboards for climate tripwires are often developed and maintained by research institutions, environmental organizations, government agencies, and international climate initiatives. They rely on data from satellites, sensors, and climate models to provide accurate and up-to-date information.
How can the public and policymakers use these dashboards?
The public and policymakers can use these dashboards to track climate indicators, understand potential risks, and support evidence-based climate action. They provide transparency and facilitate communication about climate change impacts and necessary interventions.
Are the data on these dashboards regularly updated and verified?
Yes, the data presented on open dashboards for climate tripwires are typically updated regularly, often in real-time or near real-time. They undergo verification and quality control processes to ensure accuracy and reliability for users relying on this information.