The Fundamental States of Water: A Microscopic Perspective
Water, a substance indispensable to life as we know it, exhibits a remarkable diversity in its physical form. These forms, commonly known as solid (ice), liquid (water), and gas (steam or vapor), are not arbitrary but are dictated by the interplay of temperature and pressure. Understanding these states is the first step in unraveling the complexities of its phase diagram. At a microscopic level, the behavior of water molecules – their arrangement, motion, and the forces between them – determines which phase prevails. In the solid state, ice, water molecules are locked into a highly ordered, crystalline lattice structure. This structure, characterized by strong hydrogen bonds between adjacent molecules, restricts their movement to vibrations around fixed positions. The rigidity of this lattice is what gives ice its solid form. As heat is added, increasing the kinetic energy of the molecules, these vibrations become more energetic. When the energy surpasses the strength of the intermolecular forces holding the lattice together, the molecules begin to break free from their fixed positions, allowing for greater translational and rotational motion. This transition marks the onset of the liquid phase. In liquid water, molecules are still held together by hydrogen bonds, but these bonds are constantly breaking and reforming, allowing the molecules to slide past one another. This fluidity is the hallmark of the liquid state. The arrangement is less ordered than in ice, with a dynamic equilibrium between close packing and more dispersed configurations. Further addition of energy, increasing the kinetic energy even more, allows the molecules to overcome the intermolecular forces that hold them together in the liquid state. This leads to the gaseous state, where water molecules move almost independently, with vast distances between them compared to their size. In steam, hydrogen bonds are largely broken, and molecules collide with each other and the walls of their container with high velocity. The gas phase is characterized by its compressibility and expansion to fill any available volume. The fundamental difference between these states, therefore, lies in the degree of molecular order and the strength of intermolecular interactions, which are directly influenced by temperature and pressure.
The phase diagram of water is a fascinating topic that illustrates the different states of water—solid, liquid, and gas—under varying temperature and pressure conditions. For a deeper understanding of this concept, you can explore a related article that delves into the intricacies of phase transitions and their implications in various scientific fields. To read more about this, visit this article.
Exploring the Pressure-Temperature Landscape: The Phase Diagram Unveiled
The phase diagram of water is a graphical representation that maps out the stable states of water under various combinations of temperature and pressure. It serves as a powerful tool for scientists and engineers to predict the behavior of water in different conditions and to understand the transitions between its solid, liquid, and gaseous phases. This diagram is typically plotted with temperature on the x-axis and pressure on the y-axis. The regions within the diagram represent the conditions under which each phase is thermodynamically stable. These regions are separated by lines, known as phase boundaries or coexistence curves, which indicate the conditions where two phases can exist in equilibrium. Understanding these boundaries is crucial for comprehending the transitions that occur when temperature or pressure is altered. The shape of these curves is not arbitrary but is governed by thermodynamic principles, particularly the Clausius-Clapeyron relation, which describes the relationship between pressure, temperature, and the latent heat of a phase transition. The phase diagram effectively visualizes how changes in macroscopic properties like temperature and pressure influence the microscopic arrangement and motion of water molecules. It is a concise yet comprehensive summary of water’s physical behavior, allowing for predictions about its state without the need for direct experimentation under every conceivable condition. The intricate interplay of these variables is what gives rise to the diverse phenomena observed with water, from the freezing of a lake to the formation of clouds.
The Triple Point: A Unique Convergence of States
At a specific and unique point on the phase diagram, all three phases of water – solid, liquid, and gas – can coexist in thermodynamic equilibrium. This point is known as the triple point. For water, the triple point occurs at a temperature of 273.16 Kelvin (0.01 degrees Celsius or 32.018 degrees Fahrenheit) and a pressure of 611.657 Pascals (approximately 0.006 atmospheres). This is an incredibly low pressure, significantly below atmospheric pressure at sea level. At the triple point, the vapor pressure of the solid (ice) is exactly equal to the vapor pressure of the liquid (water). This means that the rate at which ice sublimes into vapor is equal to the rate at which water vapor condenses into ice, and simultaneously, the rate at which ice melts into water is equal to the rate at which water freezes into ice, and the rate at which water evaporates into vapor is equal to the rate at which water vapor condenses into water. Consequently, no net change in the amount of any of the three phases occurs. The triple point is a fundamental reference point for temperature calibration, as it is precisely defined and reproducible. It underscores the delicate balance of forces and energy that governs the states of matter and highlights how temperature and pressure are inextricably linked in determining phase stability. The existence of this singular point emphasizes the continuous nature of the phase transitions as we move across the phase diagram.
The Critical Point: The Boundary of Distinction
As the temperature and pressure increase along the liquid-gas coexistence curve, the properties of the liquid and gas phases become increasingly similar. The density of the liquid decreases, and the density of the gas increases. The surface tension of the liquid diminishes, and the distinction between the two phases blurs. Eventually, at a specific temperature and pressure known as the critical point, the densities of the liquid and gas phases become identical. For water, the critical temperature is approximately 647.096 Kelvin (373.946 degrees Celsius or 705.103 degrees Fahrenheit) and the critical pressure is about 22.064 Megapascals (approximately 217.7 atmospheres). Beyond the critical point, the distinction between liquid and gas disappears entirely. The substance exists as a single, homogeneous phase called a supercritical fluid. In a supercritical fluid, the substance possesses properties of both liquids and gases. It has the density of a liquid, allowing it to dissolve substances, but it can flow and diffuse like a gas, enabling it to penetrate porous materials. Supercritical fluids have numerous industrial applications, such as in decaffeination of coffee, extraction of natural products, and as environmentally friendly solvents. The critical point represents the highest temperature and pressure at which a substance can exist as a distinct liquid and gas phase. Above this point, the very concept of “boiling” or “condensation” ceases to apply.
Navigating the Transitions: From Solid to Liquid and Beyond
The lines on the phase diagram represent the conditions under which phase transitions occur. These transitions involve the absorption or release of energy, known as latent heat, to overcome or establish intermolecular forces.
Melting and Freezing: The Solid-Liquid Equilibrium
The line separating the solid and liquid regions is the melting curve, also known as the fusion curve or the solid-liquid coexistence curve. This line depicts the temperatures and pressures at which ice and liquid water are in equilibrium. For most substances, the melting curve has a positive slope, meaning that as pressure increases, the melting point also increases. This is because increased pressure favors the more compact solid phase. However, water is an anomaly. Its melting curve has a negative slope. This unusual characteristic is due to the unique crystalline structure of ice, which is less dense than liquid water. As pressure increases, it favors the denser liquid phase, thus lowering the melting point. This is why ice skates can glide on a thin layer of water formed by the pressure of the blade, and why ice melts underfoot even in cold conditions. The process of melting involves adding energy to break the hydrogen bonds in the ice lattice, allowing molecules to move more freely. Freezing is the reverse process, where liquid water loses energy, and molecules arrange themselves into the ordered ice structure.
Vaporization and Condensation: The Liquid-Gas Equilibrium
The line separating the liquid and gas regions is the vaporization curve, also known as the boiling curve or the liquid-gas coexistence curve. This curve shows the temperatures and pressures at which liquid water and water vapor are in equilibrium. As temperature increases at a constant pressure, the kinetic energy of the molecules in liquid water increases, allowing them to overcome the intermolecular forces and escape into the gaseous phase. This process is called vaporization or boiling. Conversely, when the vapor cools or the pressure increases, the molecules lose kinetic energy and return to the liquid phase through condensation. The boiling point of water is dependent on pressure. At standard atmospheric pressure (1 atmosphere), water boils at 100 degrees Celsius (212 degrees Fahrenheit). However, at higher altitudes, where atmospheric pressure is lower, water boils at a lower temperature. Conversely, in a pressure cooker, the increased pressure raises the boiling point, allowing food to cook faster. The vaporization curve extends from the triple point up to the critical point.
Sublimation and Deposition: The Solid-Gas Equilibrium
The line separating the solid and gas regions is the sublimation curve, also known as the solid-gas coexistence curve. This line represents the conditions under which solid ice and water vapor are in equilibrium. Sublimation is the direct transition of a substance from the solid to the gaseous state, without passing through the liquid phase. This phenomenon occurs when the temperature and pressure are below the triple point. A common example is the “disappearance” of ice in a freezer, even if the temperature remains below freezing. This is because a small amount of water vapor is always present in the air, and the ice sublimes into this vapor. Deposition is the reverse process, where water vapor directly transforms into ice, bypassing the liquid phase. This is how frost forms on cold surfaces. The sublimation curve also originates at absolute zero pressure and extends to the triple point.
Beyond the Basics: Special Conditions and Anomalies
Water’s phase diagram is not without its peculiarities, the most notable being the anomalous behavior of its solid phases. While we commonly refer to “ice” as a single solid form, water actually exhibits numerous distinct crystalline structures, known as polymorphs.
The Multifaceted Nature of Ice: Ice Polymorphs
Under varying pressures, water can freeze into different crystalline arrangements, each with its own unique density and properties. At atmospheric pressure, ice typically forms the hexagonal structure known as Ice Ih (Ice One h). However, under increasing pressure, water can be forced into more compact crystalline forms, denoted as Ice II, Ice III, Ice V, and so on, up to Ice XIX (as of recent discoveries). These high-pressure phases are denser than liquid water and are found deep within the Earth’s mantle and in the icy moons of outer planets. The phase diagram extends to very high pressures, revealing a complex landscape of these ice polymorphs. Each transition between these solid phases occurs at specific temperature and pressure combinations, forming additional lines on an extended phase diagram that goes beyond the typical triple point representation. The study of these ice polymorphs is an active area of research, with implications for planetary science and materials science. The negative slope of the Ice Ih melting curve is a direct consequence of the open, hydrogen-bonded structure of this particular polymorph.
Supercooling and Superheating: Metastable States
While the phase diagram outlines the conditions for stable equilibrium, it is possible to temporarily exist outside these stable regions. Supercooling refers to the phenomenon where a liquid is cooled below its freezing point without solidifying. The liquid is in a metastable state, meaning it is not in its most stable form but is prevented from transitioning by a lack of nucleation sites or sufficient energy for the phase change to initiate. A slight disturbance, such as a gentle shake or the introduction of a seed crystal, can trigger rapid freezing. Similarly, superheating is the phenomenon where a liquid is heated above its boiling point without boiling. Again, the liquid is in a metastable state. Boiling typically requires nucleation sites (imperfections on the container surface or dissolved gases) for bubbles to form. In their absence, the liquid can reach temperatures significantly above its normal boiling point. However, like supercooled liquids, superheated liquids are unstable and can transition to the gaseous phase violently if disturbed, leading to dangerous situations. These metastable states highlight that phase transitions are often kinetically controlled processes, not purely thermodynamically dictated.
The phase diagram of water is a fascinating representation that illustrates the different states of water—solid, liquid, and gas—under varying temperature and pressure conditions. Understanding this diagram is crucial for various scientific fields, including chemistry and environmental science. For those interested in exploring more about the unique properties of water and its behavior in different phases, you might find this related article on Freaky Science particularly enlightening.
Applications and Implications: Harnessing Water’s Phase Behavior
| Phase | Temperature Range (°C) | Pressure Range (atm) | Description |
|---|---|---|---|
| Ice (Solid) | Below 0 | 0.006 to ~2000 | Water molecules are in a fixed, crystalline structure. |
| Liquid Water | 0 to 100 | 0.006 to ~1000 | Water molecules are free to move but remain close together. |
| Water Vapor (Gas) | Above 100 | Below 0.006 | Water molecules are widely spaced and move freely. |
| Triple Point | 0.01 | 0.006 | Temperature and pressure where solid, liquid, and gas coexist. |
| Critical Point | 374 | 218 | Temperature and pressure above which liquid and gas phases are indistinguishable. |
The understanding of water’s phase diagram has profound implications across various scientific disciplines and technological applications. From predicting weather patterns to designing industrial processes, knowledge of how temperature and pressure influence water’s state is essential.
Weather and Climate: The Water Cycle in Action
The phase diagram of water is fundamental to understanding the Earth’s water cycle and climate. Atmospheric processes, such as evaporation, condensation, and precipitation, are all direct manifestations of water’s phase transitions. The evaporation of oceans and lakes, driven by solar energy, injects water vapor into the atmosphere. As this moist air rises and cools, it reaches saturation, leading to condensation and the formation of clouds. The subsequent growth of cloud droplets and ice crystals, followed by precipitation in the form of rain, snow, or hail, are all dictated by the temperature and pressure conditions within the atmosphere, which can be broadly understood through the lens of water’s phase behavior. Variations in global temperature and pressure, whether natural or anthropogenic, directly influence the frequency and intensity of these phase transitions, impacting weather patterns and long-term climate. The existence of different forms of precipitation, from rain to snow, is a clear indicator of phase changes occurring at different temperatures and pressures.
Industrial Processes: From Food to Fuels
Numerous industrial processes rely on precise control of temperature and pressure to manipulate the state of water or utilize its unique properties. In the food industry, steam generation is crucial for sterilization and cooking. The controlled condensation of steam is used in refrigeration systems. The extraction of valuable compounds from natural products, such as oils from plants or caffeine from coffee beans, often utilizes supercritical carbon dioxide or water as a solvent, exploiting their unique properties beyond the critical point. In power generation, water is heated to form steam, which drives turbines to produce electricity. The design of boilers, turbines, and condensers in power plants is heavily influenced by the thermodynamic properties of water at high temperatures and pressures. Furthermore, in chemical engineering, understanding the solubility of substances in water across different phases is critical for reaction design and separation processes. The ability to manipulate the vapor pressure of water, for instance, is key to distillation and evaporation techniques. The phase diagram provides engineers with the data needed to optimize these processes for efficiency and safety.
Everyday Phenomena: The Familiarity of Water’s Forms
Even in our daily lives, we encounter the consequences of water’s phase diagram. The formation of dew on grass on a cool morning, the melting of ice cubes in a drink, the steaming of a kettle, and the freezing of a puddle are all everyday examples of phase transitions. The way water boils in a pot at different altitudes showcases the pressure dependence of its boiling point. The phenomenon of fog or mist forming is a visual representation of condensation occurring in the atmosphere. Understanding these simple occurrences at a deeper level, through the framework of the phase diagram, enhances our appreciation for the fundamental science governing the world around us. The very predictability of water’s behavior under different conditions is a testament to the power of understanding its phase diagram.
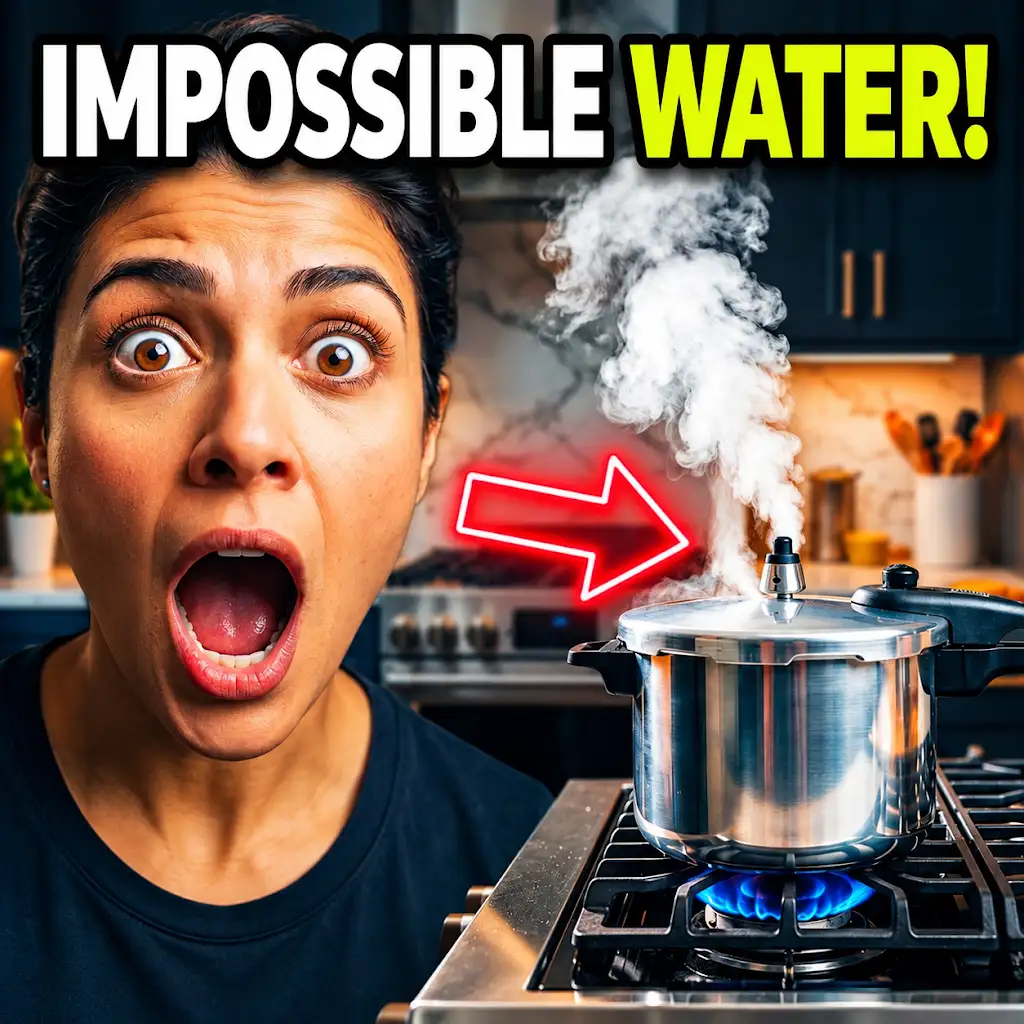
Why This Water Doesn’t Boil at 100°C
FAQs
What is a phase diagram?
A phase diagram is a graphical representation of the physical states of a substance under different conditions of temperature and pressure.
How many phases of water are represented in its phase diagram?
The phase diagram of water represents three phases: solid (ice), liquid (water), and gas (water vapor).
What are the critical point and triple point in the phase diagram of water?
The critical point is the point at which the distinction between liquid and gas phases becomes blurred. The triple point is the point at which all three phases (solid, liquid, gas) coexist in equilibrium.
How does pressure and temperature affect the phase of water in its phase diagram?
Increasing pressure on water tends to stabilize the liquid phase and solidify it into ice. Increasing temperature, on the other hand, tends to favor the transition from solid to liquid and then to gas.
What is the most common phase of water on Earth based on its phase diagram?
On Earth, the most common phase of water is liquid, as it exists in oceans, rivers, lakes, and most living organisms.